Short-term trading has become one of the most popular ways for traders to capitalise on quick market movements. Whether you trade intraday or hold positions for a few days, understanding stock charts is the foundation of successful trading. If you’ve been searching for How to analyse stock charts for short-term trading, this guide will give you a complete, practical, and beginner-friendly explanation.
Short-term traders rely entirely on price action, candlestick patterns, chart indicators, support and resistance, and volume behaviour. By the end of this blog, you’ll clearly understand how to analyse stock charts for short-term trading systematically and profitably.
1. Why Chart Analysis Is Crucial for Short-Term Trading
If you aim to gain from small fluctuations in prices, then it is very important to learn how to analyse stock charts for a short-term trade. Stock charts depict the psychology of buyers and sellers and represent momentum, strength of trend, volatility, and reversal signals in real time. While long-term investing is heavily dependent on fundamentals short-term trading depends entirely on technical charts.
2. Choosing the Right Timeframes
Understanding timeframes is the first step in how to analyse stock charts for short-term trading.
Here’s how different traders use charts:
- Scalpers: 1-minute, 3-minute charts
- Intraday traders: 5-minute, 15-minute charts
- Short-term swing traders: 30-minute, 1-hour, 1-day charts
The best practice is to adopt Multiple Timeframe Analysis (MTA). It helps traders see the bigger trend while taking entries on smaller charts. This strategy alone can drastically improve how to analyse stock charts for short-term trading.
3. Mastering Candlestick Patterns
One of the most important parts of learning how to analyse stock charts for short-term trading is understanding candlestick behaviour. Candlesticks representing the battle between buyers and sellers.
Important candlestick patterns include:
- Hammer — indicates bullish reversal.
- Shooting Star — shows bearish reversal.
- Engulfing Pattern — powerful trend-changing signal
- Doji — market indecision
A trader who masters these patterns gains a major edge in understanding how to analyse stock charts for short-term trading effectively.
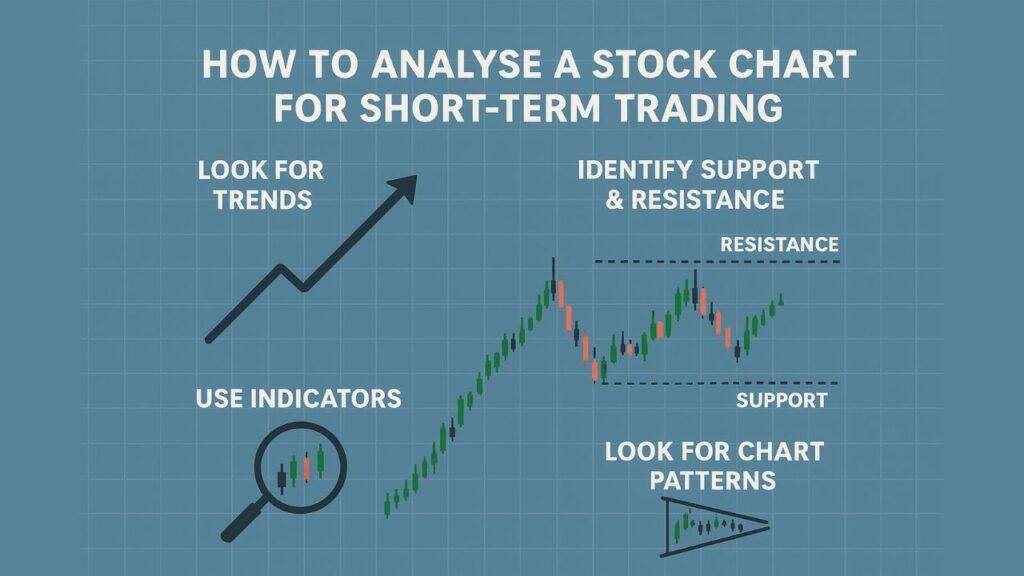
4. Identifying Trends the Right Way
Trend analysis is the backbone of how to analyse stock charts for short-term trading.
You classify trends like this:
- Uptrend: Higher highs and higher lows
- Downtrend: Lower highs and lower lows
- Sideways: Price consolidates between fixed zones
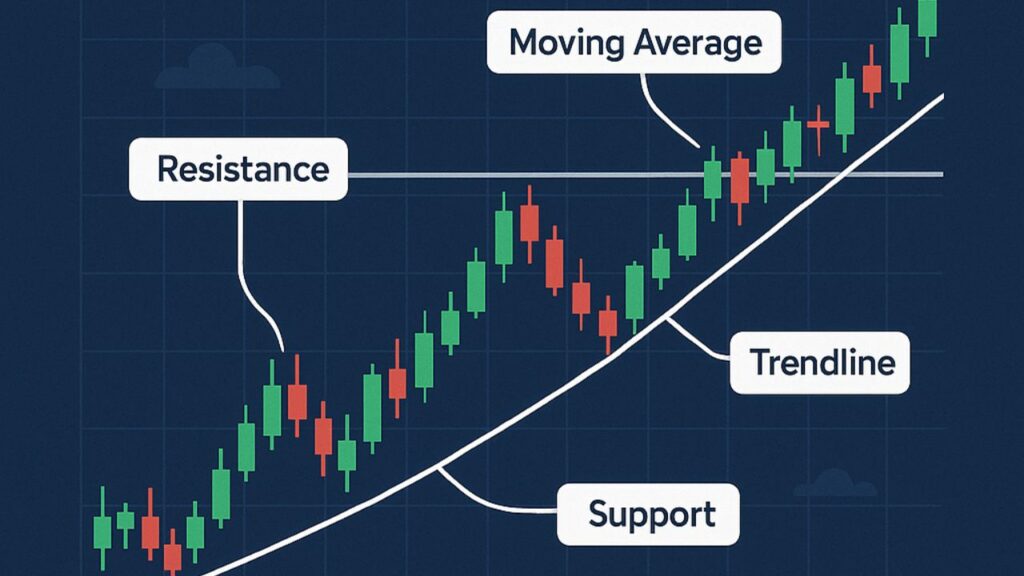
Support your trend identification using tools like:
- Trendlines
- Moving averages (20 EMA, 50 EMA, 200 EMA)
- Price channels
Trend trading is simple: trade with the direction of momentum. This principle improves your understanding of how to analyse stock charts for short-term trading significantly.
5. Support and Resistance: The Real Market Levels
To successfully learn how to analyse stock charts for short-term trading, you must master support and resistance zones.
- Support levels
- Where buyers step in and the price tends to bounce.
- Resistance levels
- Where sellers step in and the price tends to fall.
- Short-term traders often mark:
- Previous Day High (PDH)
- Previous Day Low (PDL)
- Round numbers (₹100, ₹500, ₹1000)
- Swing highs/lows
When price breaks a major level with volume, momentum traders jump in. Understanding these levels is a core part of how to analyse stock charts for short-term trading.
6. Top Indicators for Short-Term Trading
Indicators help confirm what the chart is already telling us. They should be used for confirmation—not prediction.
- Momentum Indicators
- RSI (Overbought/oversold conditions)
- MACD (Trend momentum + crossovers)
- Volatility Indicators
- Bollinger Bands (Price contraction/expansion)
- ATR (Volatility measurement)
- Trend Indicators
- Moving Averages
- Supertrend
Using a few reliable indicators helps deepen your knowledge of how to analyse stock charts for short-term trading without cluttering your screen.
7. Chart Patterns Every Short-Term Trader Should Know
Chart patterns appear repeatedly because human psychology never changes. If you really wish to learn how to analyse stock charts for short-term trading, concentrate on patterns like:
- triangles (ascending, descending, symmetrical)
- Flag & Pennant patterns
- Head & Shoulders / Inverse H&S
- Double Top & Double Bottom
- Cup & Handle pattern
These patterns help you recognise breakouts, breakdowns and continuation setups. Being able to recognise these patterns really helps to enhance one’s understanding of how to analyse stock charts for short-term trading with real accuracy.
8. Volume Analysis: The Hidden Power Behind Price
Volume is the fuel behind price movement. When learning how to analyse stock charts for short-term trading, volume must never be ignored.
How volume helps:
- High volume validates a breakout.
- Low volume signals indicate the trend’s weakness.
- Volume points shows the activity.
A breakout without any volume is a trap A breakout with heavy volume is usually the true trend.
9. Entry and Exit Strategies Based on Charts
Without entry and exit planning, stock chart analysis is not complete for short-term trading.
- Best Entry Strategies
- Breakout entry
- Retest and bounce entry
- Pullback entry using EMAs
- Trendline break entry
- Best Exit Strategies
- Previous swing high/low targets
- Trailing stop-loss
- Risk–reward ratio (1:2 or 1:3)
- Partial profit booking
A disciplined exit strategy is equally important as a perfect entry in How to analyse stock charts for short-term trading.
10. Common Mistakes Traders Must Avoid
Even if you know how to analyse stock charts for short-term trading, these mistakes can ruin your results:
- Trading without confirmation
- Overusing indicators
- Entering trades emotionally
- Ignoring trend direction
- Not using stop-loss
- Revenge trading after losses
- Avoiding these mistakes will keep your analysis sharp and your capital safe.
Conclusion
Mastering how to analyse stock charts for short-term trading requires practice, patience, and a structured approach. When you combine candlestick analysis, trend direction, support–resistance, indicators, chart patterns, and volume behaviour, you gain a powerful toolkit to make informed trading decisions.
5 FAQs
1. What is the first step to learn how to analyse a stock chart for short-term trading?
- The first step is understanding basic chart elements: candlesticks, timeframes, volume, and support–resistance levels. These fundamentals help you read market structure clearly before applying indicators or patterns.
2. Which timeframe is best for short-term trading?
- For intraday traders, 5-minute and 15-minute charts work best. For short-term swing traders, 30-minute, 1-hour, and daily charts are more reliable. Using multiple timeframes together gives a better confirmation.
3. Do I need indicators to analyse stock charts?
- Indicators help but are not required. The most important things are price action, candlestick patterns, and support–resistance zones. Confirmation should be sought in RSI, MACD, and moving averages; these should not be used as a means of receiving random signals.
4. How do I know if a breakout is real or fake?
- The genuine breakout is supported by strong volume and a retest of the breakout level. Fake breakouts usually occur with low volume and quick reversals. Volume analysis is crucial in differentiating both them.
5. Can beginners analyse stock charts effectively?
- beginners can analyse charts effectively with practice and a structured learning approach. Even a new traders can confidently make decisions for short-term trading by trends, patterns and key levels over time.