If you want to succeed in trading or investing one concept you cannot ignore is how support and resistance work. These are the most powerful and widely used tools in technical analysis. Whether you are a beginner or an experienced trader, understanding How Support and resistance work can completely change your decision-making in the market.
Support and resistance are like invisible walls drawn on a price chart. They assist traders in locating points for entering and exiting the market and also indicate possible points for reversal. This guide will teach you everything about support and resistance and how to utilize them.
📉 What is Support?
To understand How Support and resistance work, you first need to understand what support means.
Support is a price level where a stock or asset tends to stop falling and may reverse upward. This happens because demand increases at that level. Buyers see the price as “cheap” and step in to purchase.
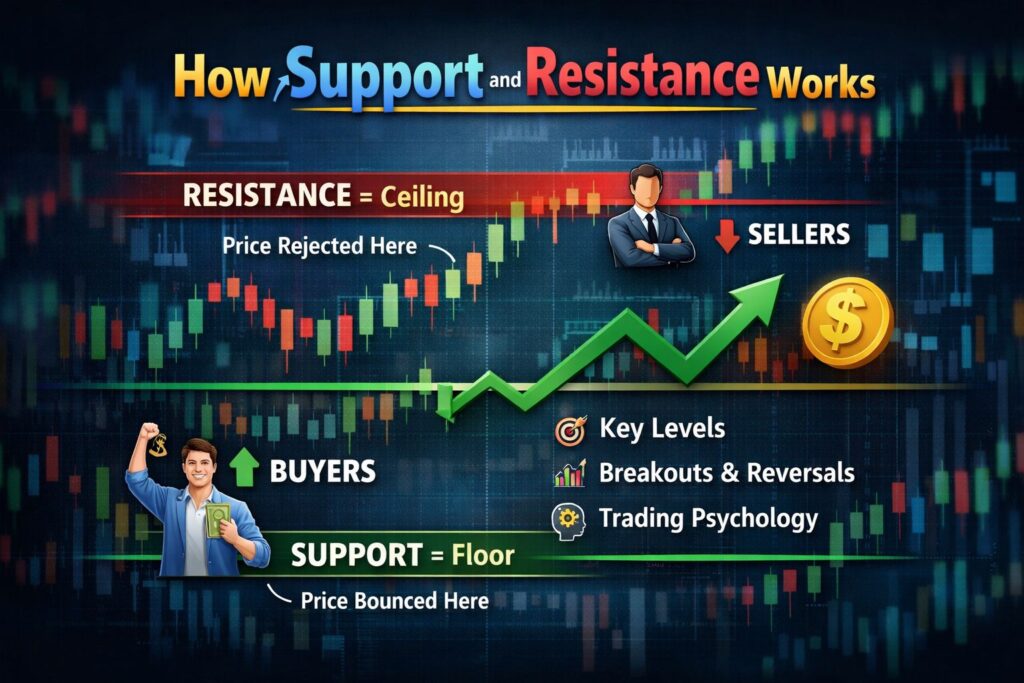
Think of support as a “floor” in the market. Just like a ball bounces when it hits the ground, prices often bounce from support levels.
Example, if a stock repeatedly falls to ₹100 and then moves up, ₹100 becomes a strong support level. This is a clear demonstration of How Support and resistance work in real market conditions.
📈 What is Resistance?
Now, let’s understand resistance to complete the concept of How Support and resistance work.
Resistance is the opposite of support. It is a price level where the stock stops rising and may reverse downward. This happens because sellers dominate at that level.
You can think of resistance as a “ceiling.” When the price hits this ceiling, it struggles to go higher.
For instance, if a stock reaches ₹200 multiple times and falls back, ₹200 becomes a resistance level. This behaviour again shows How Support and resistance work through repeated price reactions.
⚖️ Psychology Behind Support and Resistance
To truly master How Support and resistance work, you must understand market psychology.
The stock market is driven by human emotions like fear and greed. Support and resistance levels form because traders remember past prices.
- At support: Buyers feel confident (low price)
- At resistance: Sellers feel confident (high price)
For example:
- Traders who missed buying earlier will buy at support
- Traders who got stuck earlier will sell at resistance
This collective behaviour creates predictable patterns, which is exactly why How Support and Resistance works so effectively.
🔍 Types of Support and Resistance
There are different forms you need to know to fully grasp How Support and resistance work.
- Horizontal Support and Resistance
These are straight lines drawn across repeated highs and lows. Most common and beginner-friendly.
- Trendline Support and Resistance
Diagonal lines that follow the trend direction. Helps identify dynamic levels.
- Dynamic Support and Resistance
Moving averages (like 50 EMA, 200 EMA) act as support/resistance.
- Psychological Levels
Round numbers like ₹100, ₹500, and ₹1000 act as strong levels because traders focus on them.
Understanding these types helps you apply How Support and resistance work in different market conditions.
📊 How to Draw Support and Resistance
Drawing levels correctly is crucial if you want to master How Support and resistance work.
Step-by-step:
- Identify swing highs and swing lows
- Mark areas where the price reacted multiple times
- Use zones instead of exact lines
- Focus on higher timeframes for accuracy
Common mistakes:
- Drawing too many lines
- Ignoring major levels
- Forcing levels where none exist
Proper drawing is where most traders fail, even if they understand How Support and resistance work theoretically.
🚀 Breakout and Breakdown Strategy
A key part of How Support and resistance work is understanding breakouts and breakdowns.
Breakout:
- When price breaks above resistance → bullish signal
Breakdown:
- When price breaks below support → bearish signal
Confirmation:
- High volume
- Strong candle close
- Retest of the level
Fake Breakouts (Trap):
- Sometimes, price breaks are quickly reversed. This traps traders.
This is why understanding How Support and resistance work is not just about levels, but also about confirmation.
🔄 Role Reversal Concept
One of the most powerful aspects of How Support and resistance work is role reversal.
- Old resistance becomes new support
- Old support becomes new resistance
Why does this happen:
- Traders change their positions
- Buyers become sellers and vice versa
Example:
If ₹200 was resistance and price breaks above it, ₹200 often becomes support.
This concept is widely used by professional traders and is a key reason why How Support and Resistance works so reliably.
💡 Trading Strategies Using Support and Resistance
Now let’s apply How Support and resistance work in real trading.
- Buy at Support
Enter near support
Place a stop loss below support
Target next resistance
- Sell at Resistance
Enter near resistance
Stop loss above resistance
Target support
- Breakout Trading
Enter after breakout confirmation
Avoid early entries
- Pullback Strategy
Wait for the price to retest the level
Enter after confirmation
- Risk Management:
Always maintain a 1:2 risk-reward ratio
Never trade without a stop loss
These strategies show the practical side of How Support and resistance work in daily trading.
⚠️ Common Mistakes Traders Make
Even after learning How Support and resistance work, many traders fail due to these mistakes:
- Overcomplicating charts
- Ignoring trend direction
- Trading every level blindly
- Not waiting for confirmation
- Emotional decision-making
Avoiding these mistakes can significantly improve your results.
🧠 Pro Tips for Better Accuracy
To master How Support and resistance work, combine it with:
- RSI (for overbought/oversold confirmation)
- MACD (trend strength)
- Candlestick patterns (entry confirmation)
- Volume analysis
Also:
- Always analyse higher timeframes first
- Practice on historical charts
- Keep learning and refining
These tips will take your understanding of How Support and resistance work to a professional level.
📚 Real Market Example (Conceptual)
Let’s say a stock is moving between ₹100 and ₹150:
- ₹100 = Support
- ₹150 = Resistance
Trade Setup:
- Buy near ₹100
- Stop loss at ₹95
- Target ₹150
If price breaks ₹150:
- Wait for retest
- Enter again for a higher target
This simple example clearly explains How Support and resistance work in real scenarios.

🎯 Conclusion
By now, you should have a complete understanding of How Support and resistance work. It is one of the simplest yet most powerful tools in trading.
The key takeaway is:
- Markets move based on psychology
- Price respects levels repeatedly
- Confirmation is more important than prediction
If you consistently practice and apply these concepts, you can significantly improve your trading performance


Pingback: Proven way for Daily Trading Routine for Better Discipline