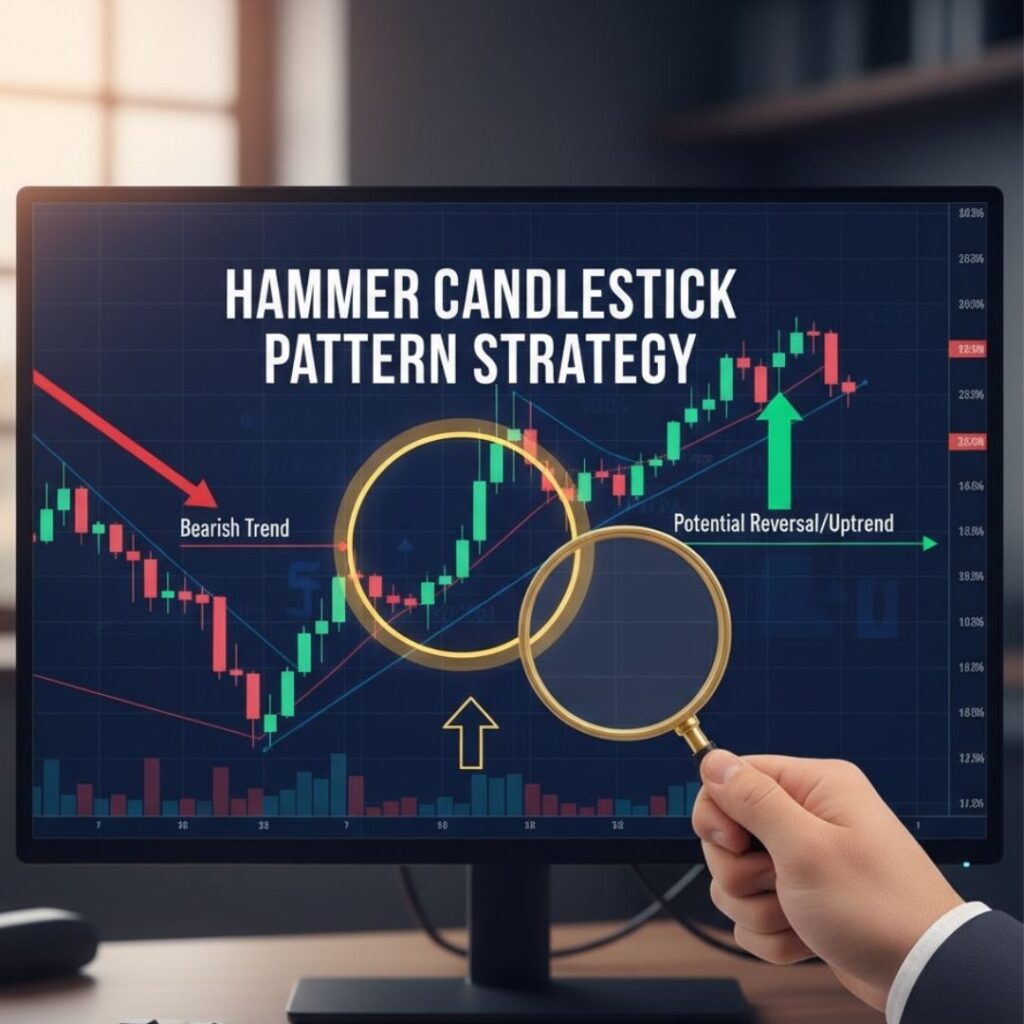
When it comes to trading in the stock market, price action tells a story that indicators often miss. Of the dozens of candlestick patterns, one of the most reliable reversal indications is the Hammer Candlestick Pattern Strategy. This simple yet powerful tool allows traders to identify likely bottoms in the market and go long more confidently. Here in this blog, we will see what is the hammer pattern, how it operates, and how to create a profitable trading strategy using the Hammer Candlestick Pattern Strategy.
What is a Hammer Candlestick Pattern?
The Hammer Candlestick Pattern Strategy revolves around a single candle that appears after a downtrend, signalling a possible bullish reversal. A hammer candlestick is one with a very small real body at the top, little to no upper shadow, and an extended lower shadow, generally at least double the size of the body.
This formation indicates that sellers forced the price down in the course of the trading session, but buyers were able to coax it back towards the opening level by the close. In short, it explains market rejection of cheaper prices and buying pressure which might be in the process of developing.
How to Identify a Hammer on the Chart
To successfully apply the Hammer Candlestick Pattern Strategy, it is necessary to identify it on the price chart of prices. The key features are:
- Follows a clear downtrend.
- The lower shadow should be at least two times the length of the real body.
- The upper shadow should be minimal or nonexistent.
- The body colour can be bullish (green) or bearish (red), but a bullish hammer is stronger.
When these conditions are satisfied, the candle signals that the sellers lost momentum and the buyers are entering.
Psychology Behind the Hammer Pattern
It is important to grasp the psychology behind the Hammer Candlestick Pattern Strategy. In a downtrend, sellers control the market. When a hammer is present, it signals that sellers forced the price lower aggressively but that the buyers entered forcefully and were able to close the candle close to its opening price.
This reversal of control from sellers to buyers suggests that the downtrend may be at its exhaustion point. The hammer is a “battle candle”, one that informs traders that bulls are getting ready to turn around market sentiment.
Confirmation is the Key
A single hammer candle does not guarantee a trend reversal. The Hammer Candlestick Pattern Strategy works best when confirmed by the next candle. Traders must wait for the next session’s candle to close higher than the hammer’s high to confirm the bullish reversal.
After confirmation, it signifies that there has been an increase in buying pressure, and the traders can go long now.
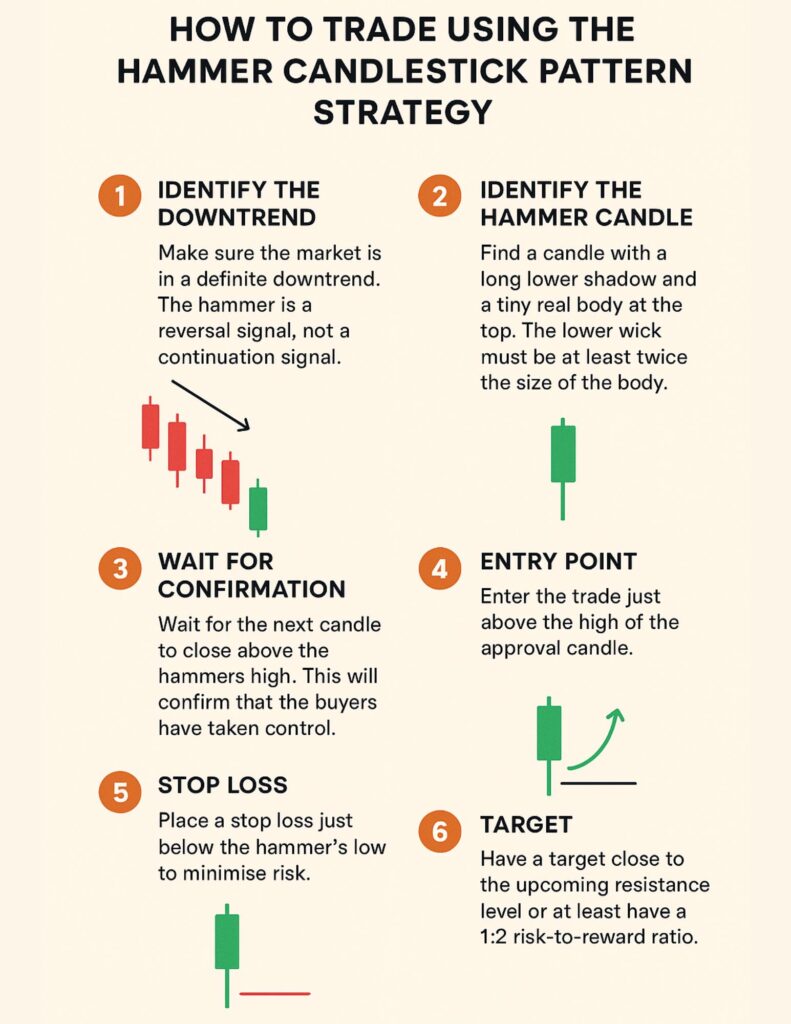
How to Trade Using the Hammer Candlestick Pattern Strategy
Dissecting how to trade using this setup step by step:
Step 1: Identify the Downtrend
- Make sure the market is in a definite downtrend. The hammer is a reversal signal, not a continuation signal.
Step 2: Identify the Hammer Candle
- Find a candle with a long lower shadow and a tiny real body at the top. The lower wick must be at least twice the size of the body.
Step 3: Wait for Confirmation
- Wait for the next candle to close above the hammers high. This will confirms that the buyers have taken control.
Step 4: Entry Point
- Enter the trade just above the high of the approval candle.
Step 5: Stop Loss
- Place a stop loss just below the hammer’s low to minimise risk.
Step 6: Target
- Have a target close to the upcoming resistance level or at least have a 1:2 risk-to-reward ratio.
By performing these steps, traders are able to employ the Hammer Candlestick Pattern Strategy more accurately and confidently.
Example of Hammer Pattern in Action
Suppose a stock like Reliance Industries has been falling for a couple of sessions. And then, on the daily chart, you notice a hammer pattern with a long lower shadow. The price opens higher the next day and closes higher than the hammer’s high, confirming the bullish reversal.
An investor who would sell at confirmation level and set a stop loss below the bottom of the hammer could ride the new trend and earn huge profits. This is a typical example of how Hammer Candlestick Pattern Strategy picks up market reversals.
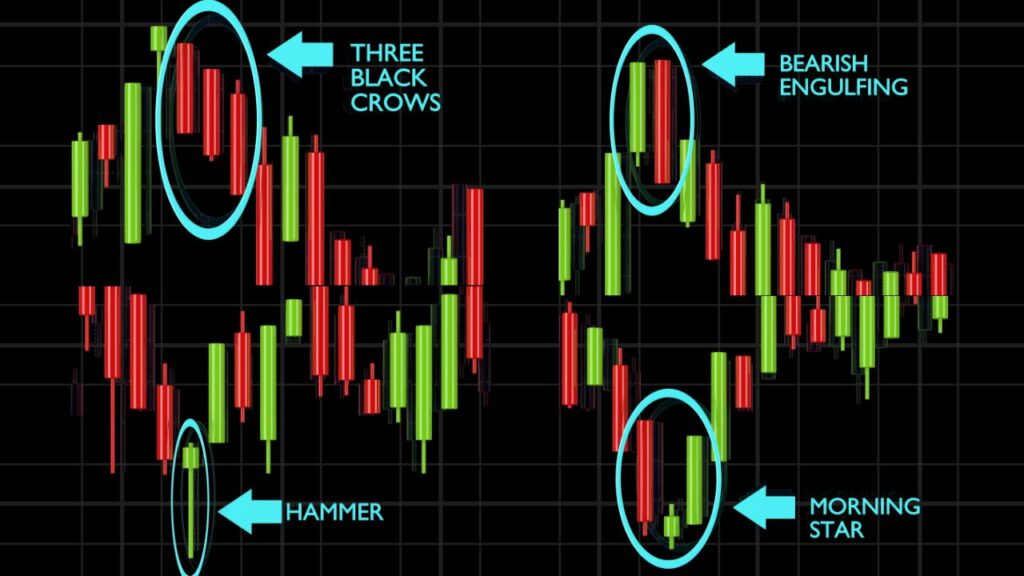
Variations of the Hammer Pattern
The Hammer Candlestick Pattern Strategy consists of two major variations that one must know:
- Inverted Hammer:
The pattern features a tiny body at the bottom with a long upper shadow. It occurs following a downtrend and also indicates a possible bullish reversal.
- Hanging Man:
Matches a hammer but forms after an uptrend. It signals a likely bearish reversal in this case.
While the two patterns share structural similarities, Hammer Candlestick Pattern Strategy is interested specifically in reversal potential after a decline.
Common Mistakes Traders do
Even with the Hammer Candlestick Pattern Strategy’s simplicity, traders fall into errors and reduce the strategy’s reliability:
- Entering before the confirmation candle is formed.
- Disregarding the direction of the overall trend and trading in horizontal markets.
- Not correlating hammer signals with volume or zones of support.
- Applying idealistically lofty objectives without considering levels of resistance.
- Avoiding of such mistakes can make the strategy more credible.
Improving Accuracy Tips
To make the Hammer Candlestick Pattern Strategy stronger, the following can be used by traders:
- Usage with Support Zones:
The closer the hammers are to robust support levels the better.
- Use Volume Confirmation:
A large volume hammer candle indicates there is higher buying interest.
- Use RSI or MACD Indicators:
If there is bullish divergence in RSI or a MACD crossover, the signal is strengthened.
- Higher Timeframes:
Daily or weekly chart hammers are stronger than those on short timeframes.
Applying a confluence of multiple factors can increase your trades’ success rate.
Backtesting the Strategy
Its a good idea to backtest the Hammer Candlestick Pattern Strategy before using it in actual trading. Backtesting it on various stocks and timeframes will indicate how frequently the pattern is successful and under what conditions it is most effective.
Some of the traders prefer that the hammer pattern is effective in trending markets as well as in proximity to major supports, particularly when accompanied by other confirmations. Testing the pattern improves confidence and consistency, reducing emotional trading decisions.
Why Traders Love the Hammer Pattern
The Hammer Candlestick Pattern Strategy is favoured by traders for several reasons:
- Simple to identify visually.
- Gives early sign of reversals.
- Suits all time frames.
- Is suitable for intraday, swing and position trading.
- Provides clear entry and exit points.
Its simplicity makes it very suitable for beginners, while its accuracy drives professional traders who use price action.
Conclusion
In conclusion, the Hammer Candlestick Pattern Strategy is a classic tool for price action and market mindset traders. It signifies hope and opportunity following a selling pressure episode, indicating that the buyers are back in the market.
The case with any strategy, success lies in discipline, confirmation, and risk management. Always pair the hammer with volume, support zones, and structure to enhance accuracy.