
The technical analysis involving candlestick formations is perhaps one of the most effective tools for the analysis of market moves and trading. Traders around the world use the charts of candlestick formations to understand the trends, make predictions about potential reversals in price and identify suitable entry/exit positions. Unlike fundamental analysis, which involves the financial position of a company, technical analysis involves price action.
The use of Technical Analysis Using Candlestick Patterns allows traders to better understand the constant struggle of bulls and bears. Each candlestick shows how the price was moving in a certain period and gives traders important information about market sentiment. Whatever level you have as a trader, you will greatly benefit from studying candlestick patterns.
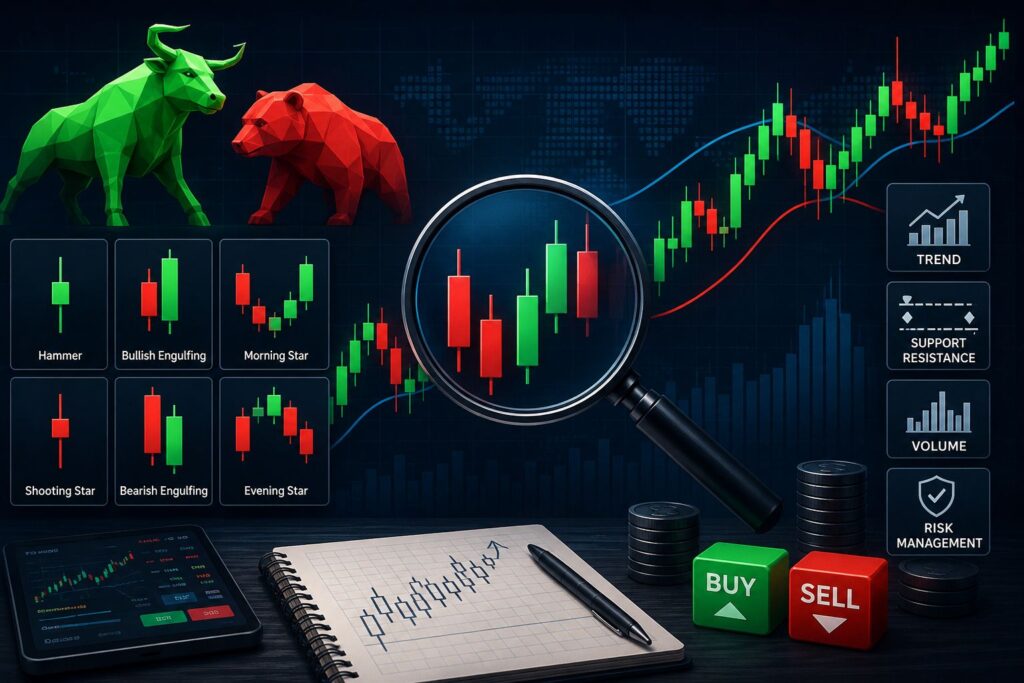
Introduction to Technical Analysis
Technical analysis is the practice of examining past price action and volume of trades in an effort to forecast future market behaviour. This concept is premised on the idea that everything known is already contained in the price and the market will continue exhibiting similar patterns in the future. Technical analysts do not look at corporate financial statements but instead use charts and indicators.
The primary aim of Technical Analysis Using Candlestick Patterns is to provide profitable trade opportunities by recognising patterns in price action. Such patterns enable traders to know whether buyers or sellers control the market.
Understanding the Candlesticks
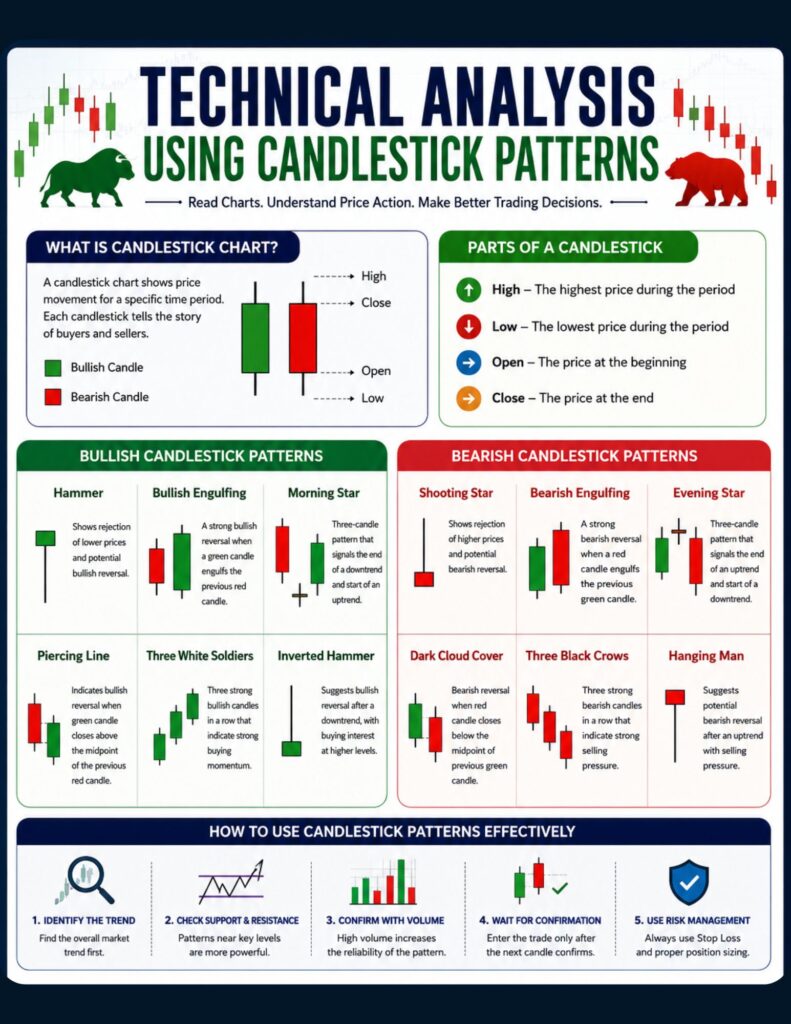
The candlestick pattern was developed in Japan, and it is one of the most commonly used chart patterns in financial trading. The candlesticks are made up of four significant price levels:
- Opening Price
- Highest Price
- Lowest Price
- Closing Price
When there is a green candlestick, it means that the closing price is higher than the opening price. If the candlestick is red the closing price is lower than the opening price.
Technical Analysis Using Candlestick Patterns Helps You Understand Market Sentiments and Potential Trends before They Occur.
Popular Bullish Candlestick Patterns
The bullish candlestick patterns signal the strengthening of the buyers and the possibility of an increase in prices.
- Hammer:
The Hammer pattern occurs at the end of a downward trend, with a small body and a long lower shadow.
- Bullish Engulfing Pattern:
It is a pattern in which the bullish candle is entirely encompassed by the preceding bearish candle. It usually suggests a robust reversal of the downward trend.
- Morning Star Pattern:
The Morning Star Pattern is a three-candle pattern that shows the termination of a bearish trend and initiation of a bullish trend. It is one of the most powerful reversal patterns based on candlestick patterns.
Bullish Candlestick Patterns
The bullish patterns signify that the buyers have taken control and the price is likely to fall. Technical Analysis Using Candlestick Patterns
- Shooting Star:
This pattern occurs in an uptrend and consists of a long upper shadow with a small body. This implies that the buyers could not sustain the higher levels.
- Bearish Engulfing:
There is a large bearish candlestick engulfing the earlier bullish candlestick.
- Evening Star:
Evening Star is a three-candle bearish reversal candle pattern that can form at market tops to indicate a potential move down.
Traders need to learn how to identify candle patterns for better decisions in their trades.
How to Use Candlestick Patterns Properly
Identifying candle patterns is not enough to make decisions about trading. It is necessary to take into consideration the whole market situation.
Step one is to consider the current trend. If the current trend is an uptrend, it will be wise to apply the bearish pattern and vice versa.
The second step is to apply the support and resistance levels. A candlestick pattern appearing at significant levels will yield better results.
The third step is to confirm the presence of the pattern using volume. High volume makes a pattern strong and more accurate due to high market activity.
The last step is to wait until the following candle confirms the appearance of the pattern.
Such methods increase the effectiveness and reliability of Technical Analysis Using Candlestick Patterns.
Use of Candlestick Patterns along with Technical Indicators
Professional traders seldom rely only on Technical Analysis Using Candlestick Patterns. They use them together with technical indicators to increase precision.
Moving Averages determine the general trend.
Relative Strength Index determines whether the market is overbought or oversold.
MACD helps to determine momentum and trend reversal.
Bollinger Bands provide a measure of market volatility and potential breakouts.
When these indicators corroborate with the candlestick pattern, traders become more certain of their decisions. This explains the reason for the use of Technical Analysis Using Candlestick Patterns in conjunction with various confirmations.
Risk Management Importance
No trading strategy can ensure consistent success. Even the best candlestick pattern can fail in view of unforeseen circumstances in the market.
For efficient risk management:
- Use stop losses always.
- Risk a small percentage of your trading capital on every trade.
- Ensure a proper risk-to-reward ratio.
- Don’t make any emotionally driven decisions.
- Adhere to your trading plan strictly.
Profitable traders concentrate more on preserving their capital than making profits. Efficient risk management is a crucial aspect of Technical Analysis Using Candlestick Patterns.
Mistakes to Be Avoided
A lot of mistakes are committed by many newbies when trading with candlesticks.
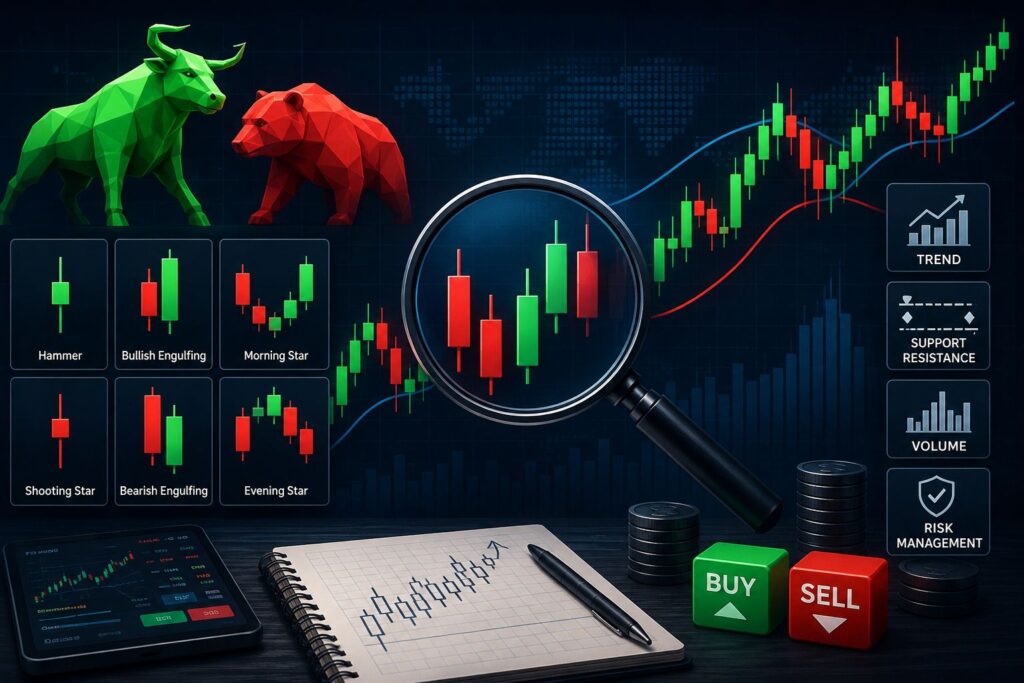
There are several mistakes made, such as trading all the patterns regardless of the confirmation, ignoring the trend of the entire market, not setting stop-loss orders, overtrading, and trading exclusively with the candlestick patterns alone.
Avoiding these mistakes will help enhance Technical Analysis Using Candlestick Patterns.
Conclusion
The ability to analyse markets through candlestick formations is among the most important skills that traders can develop to get a deeper understanding of market behaviour. Knowledge of candlestick formations will help traders to better understand the relationship between buyers and sellers and, in this way, detect market reversals or continuation, breakouts, etc.
Nevertheless, trading goes beyond the detection of candlesticks alone. Traders need to complement candlestick analysis with trend analysis, support and resistance levels, technical indicators, and sound risk management techniques.
If you are participating in the stock market, foreign exchange market, commodities market, or even cryptocurrency trading, then Technical Analysis Using Candlestick Patterns can help you make better decisions and create a good trading strategy. By studying the movements in prices and adopting a good trading strategy, you will be able to gain more confidence and become successful in the future.
Frequently Asked Questions (FAQs) Technical Analysis Using Candlestick Patterns
1. What is technical analysis using candlestick patterns?
It is a method of analyzing price charts using candlestick formations to predict future market movements.
2. Which candlestick pattern is the most reliable?
Patterns like Bullish Engulfing, Bearish Engulfing, Morning Star, and Evening Star are considered highly reliable when confirmed by trend and volume.
3. Can beginners learn candlestick patterns?
Yes. Beginners can start with basic patterns like Hammer, Doji, and Engulfing before progressing to advanced formations.
4. Are candlestick patterns enough for profitable trading?
No. They should be combined with trend analysis, support and resistance, technical indicators, and proper risk management.
5. Which markets use candlestick patterns?
Candlestick patterns are widely used in stocks, forex, commodities, indices, and cryptocurrency markets.