Intraday trading is one of the widely adopted methods to be part of the stock market trading activities, where traders buy and sell stocks in a single trading day. But, taking consistently profitable decisions in intraday trading needs analysis, knowledge about the markets and the right tools. The most prominent tool used by traders in intraday trading is the use of technical indicators.
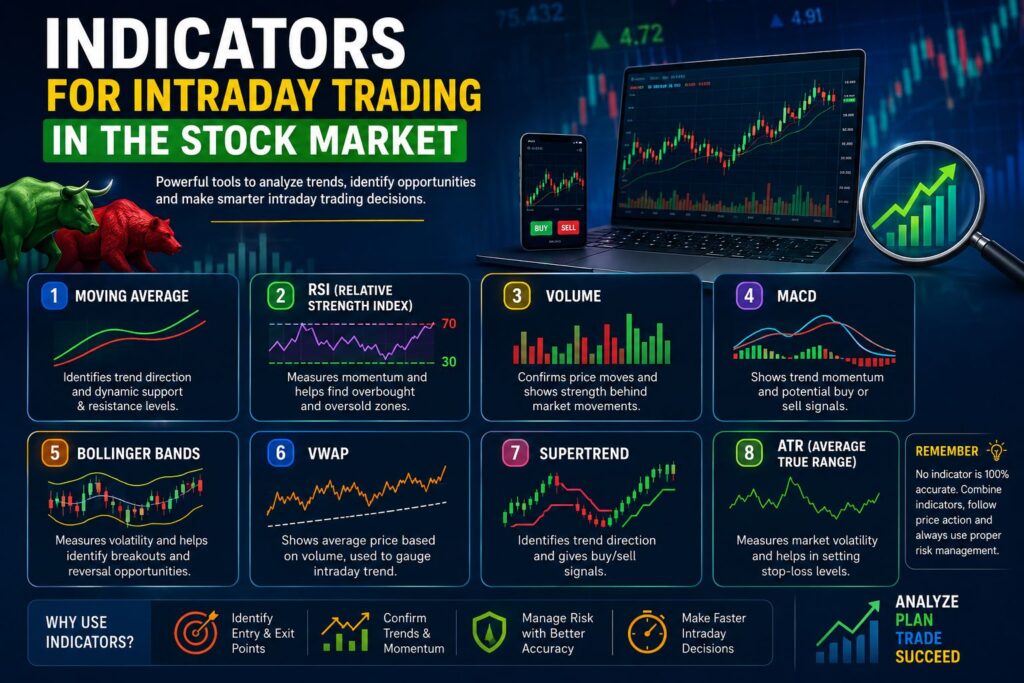
Indicators for Intraday Trading in the Stock Market assist traders in analyzing price action, trend in the market, momentum in the market, volatility in the market, and potential entry/exit points. These indicators analyze historical data related to price and volume in order to deliver useful signals.
However, although indicators do not always guarantee returns, using the right indicators with the right strategy, risk management and price action will increase the accuracy of your trades.
What Are Trading Indicators?
Trading indicators are mathematical formulas applied in technical analysis to analyse the historical data of the markets in terms of price, volume, and volatility, among others. The indicators are shown on the trading charts and help traders spot possible trading opportunities.
For intraday traders, Indicators for Intraday Trading in the Stock Market making fast decisions is crucial as trading positions are made within a couple of hours. Thus, using the right indicators will enable traders to make decisions without emotions.
Importance of Indicators in Intraday Trading
Intraday trading takes place at a very fast pace, and traders require reliable information to get an idea about the direction of the market. Indicators for Intraday Trading in the Stock Market prove to be helpful since they help in:
- Trend identification
- Determining buy and sell zones
- Understanding momentum
- Volatility measurement
- Confirmation of trades
- Stop loss determination
Traders often use multiple indicators rather than rely on a single indicator since each and every indicator has its own limitations.
Indicators Best Used for Intraday Trading
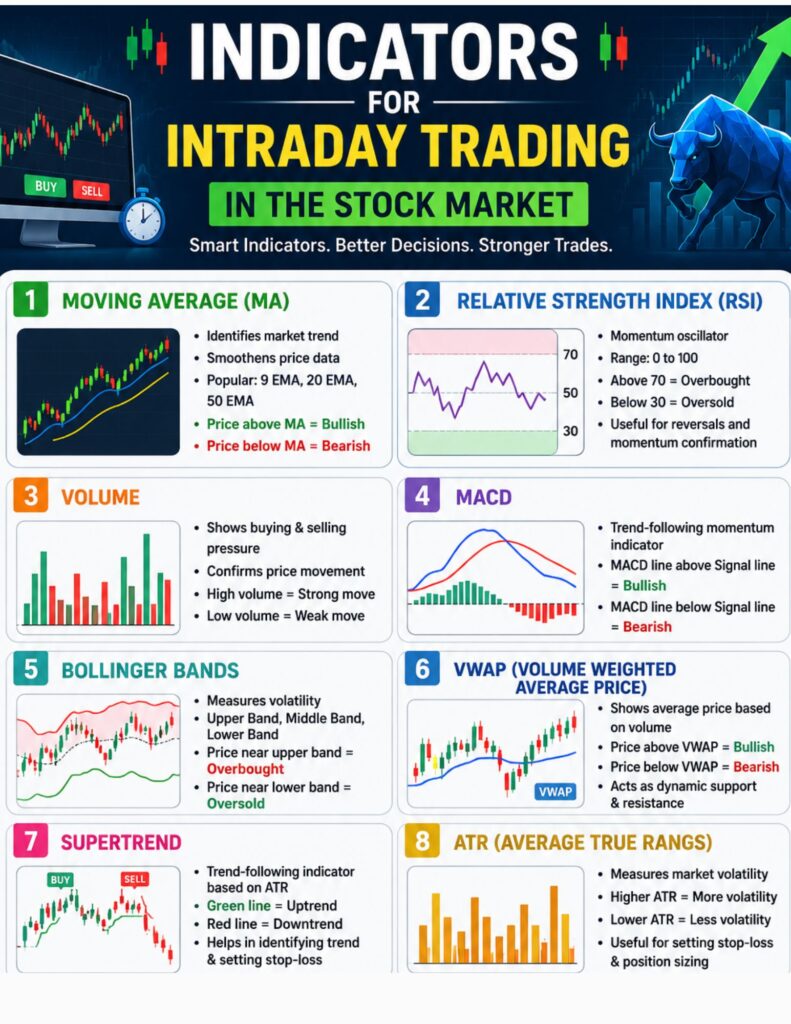
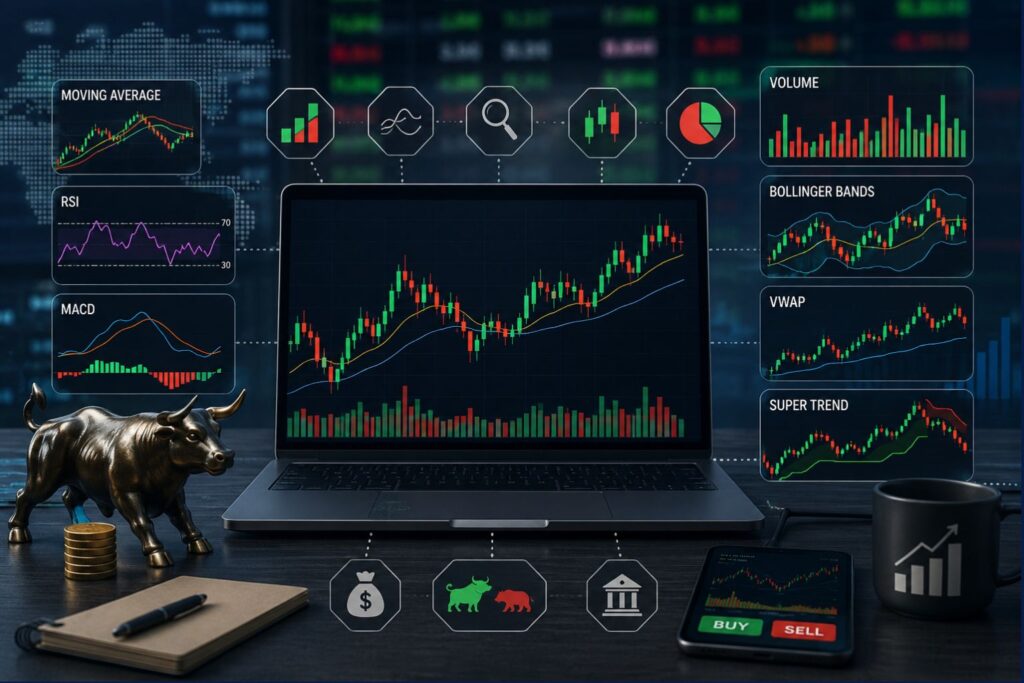
1. Moving Average (MA)
One of the most frequently used Indicators for Intraday Trading in the Stock Market is the moving average. This technical indicator measures the average value of the stock during a particular time period and it aids in determining the prevailing trend in the market.
Types of Moving Averages Include:
- Simple Moving Average (SMA)
- Exponential Moving Average (EMA)
The EMA puts more emphasis on the recent changes in the price of the stock.
Usage of Moving Averages by Traders:
- A price higher than the moving average is a sign of a potential uptrend.
- A price lower than the moving average is a sign of a potential downtrend.
Moving averages crossovers help in identifying trend changes.
Some common intraday setups are:
- 9 EMA
- 20 EMA
- 50 EMA
For instance, when the 9 EMA crosses the 20 EMA it is taken to be a bullish indication.
2. Relative Strength Index (RSI)
RSI is a momentum-based technical indicator that shows overbought and oversold stocks. The range of this indicator is between 0 and 100.
RSI Range:
- Above 70 – Overbought
- Below 30 – Oversold
RSI is used by intraday traders to identify reversals and the strength of momentum.
For example, if a stock is in a down trend and the RSI shows an improvement in the oversold level, then the intraday trader tries to find a trading opportunity.
Divergence of RSI is another indicator for Intraday Trading in the Stock Market important point that can be considered for identifying reversals in the market.
3. Volume Indicator
The most critical aspect of intraday trading is volume because it is an Indicators for Intraday Trading in the Stock Market of the involvement of both buyers and sellers.
Any price action that is accompanied by higher volume is usually regarded as more significant than one with lower volume.
Benefits of Using Volume:
- Breakout confirmation
- Heavy buying or selling
- False breakout signal
For instance, when there is a breakout in resistance accompanied by high volume, then it may show strong buying interest in that security.
4. MACD Indicator
This refers to Moving Average Convergence Divergence.
This is comprised of:
- MACD Line
- Signal Line
- Histogram
MACD Signals:
- When the MACD line moves above the signal line, it indicates bullish momentum.
- When the MACD line falls below the signal line, its indicates bearish momentum.
MACD Indicators for Intraday Trading in the Stock Market are used by day traders to find out the change and reversal in momentum.
5. Bollinger Bands
Bollinger Bands gauge price volatility and comprise the following three lines:
- Upper Band
- Middle Band
- Lower Band
An increase in volatility causes widening of the bands, whereas a decline in volatility leads to narrowing of the bands.
Intraday Applications:
- Breakout trades identification
- Overextended price movements identification
- Volatility environment identification
In case the price crosses above the upper band accompanied by high volumes, traders may identify a breakout trade signal.
6. Volume Weighted Average Price (VWAP)
It is one of the most popular indicators amongst intraday and institutional traders. The indicator represents the average price of a stock traded based on volume.
The VWAP assists traders in determining who is driving the market, either the buyers or the sellers.
VWAP Strategy:
- Above VWAP – Bullish Market Sentiment
- Below VWAP – Bearish Market Sentiment
VWAP Indicators for Intraday Trading in the Stock Market serve as a dynamic support and resistance level to many traders
7. Supertrend Indicator
The Supertrend trend-following indicator is based on price and volatility. It provides buy and sell signals.
Supertrend advantages:
- Easy to understand
- Used for identifying the trend
- Used for placing a stop loss
Whenever the Indicators for Intraday Trading in the Stock Market turn green, it means that there is an uptrend, while if it turns red, it means that there is a downtrend.
8. ATR (Average True Range)
It calculates the volatility of the market. It does not predict price direction but shows the movement of the stock.
Use of ATR in intraday trading for:
- Establishing a reasonable stop loss level
- Understanding the possible price movement
- Risk Management
A high volatility Indicators for Intraday Trading in the stock market need a different kind of risk management strategy than a low volatility stock.
Most Suitable Indicator Combination for Intraday Trading
A combination of multiple Indicators for Intraday Trading in the Stock Market makes a better trading signal.
One such combination is:
- EMA + RSI + Volume
- EMA identifies the trend
- RSI confirms momentum
- Volume confirms strength
- Another effective combination:
- VWAP + Supertrend + Volume
This setup helps traders identify trend direction and possible entry points.
Common Mistakes in the Usage of Technical Indicators
The beginners usually commit a lot of mistakes when they use technical Indicators for Intraday Trading in the Stock Market:
- Too many indicators on one chart
- No confirmation for trading
- Price action is ignored
- Overtrading
- No usage of stop loss rules
Technical indicators have to be used as an additional instrument, and not as a profitable strategy.
Risk Management in Intraday Trading
Even the best Indicators for Intraday Trading in the Stock Market cannot prevent losses if risk management is ignored.
Important risk management rules include:
- Always use stop-loss
- Maintain a proper risk-reward ratio
- Avoid risking large capital on a single trade
- Follow a trading plan
Successful traders focus more on protecting their capital than making quick profits.
Conclusion
Indicators for Intraday Trading in the Stock Market are very useful in helping traders analyse the market situation to enable them to make informed decisions. Indicators such as Moving Average, Relative Strength Index, Volume, MACD, VWAP, Bollinger Bands and Supertrend could be helpful in analysing trades.
However, profitable trading involves more than just knowing how to use the trading indicators. Profitable trading needs knowledge, discipline, patience and good risk management practices.