
Movements in the prices of the stock market are what make the stock market move, and it is crucial that everyone who participates in the stock market understands how price movements occur. One way to study price movements in the stock market is through chart patterns for stock market trading.
Regardless of whether you are a day trader or a long-term trader, knowing about chart patterns for stock market trading will be very helpful.
What are chart patterns?
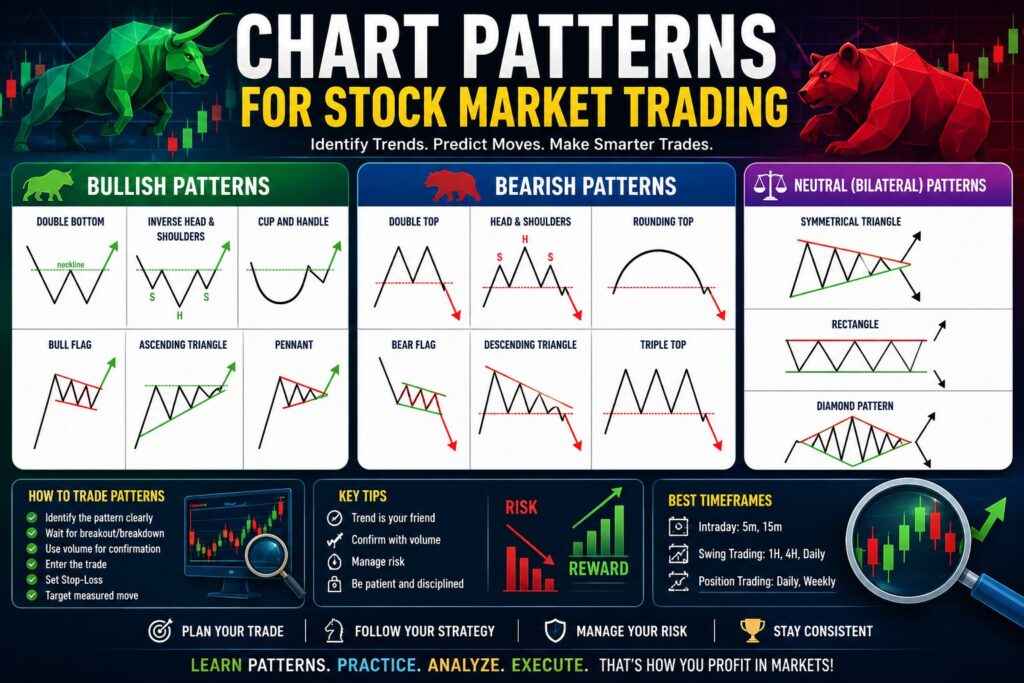
Chart patterns for stock market trading are certain formations that occur as a result of the price movement of stocks in the charts. The formations are an expression of the psychology of the buyers and sellers in the market, which helps traders forecast future price movement.
The benefit of applying the formations is that there is no need for assumptions on the trader’s part, because once they have been used along with other indicators like volume, they become highly reliable.
Why Are Chart Patterns Important?
There are many benefits to learning chart patterns when trading stocks:
- Identifies market trends.
- Enhances timing of entries and exits.
- Facilitates easy identification for stop losses.
- Enhances risk management.
- Gives you greater confidence in your trading.
Professional traders often use chart patterns because they reflect real market behaviour rather than opinions or emotions.
Types of Chart Patterns
There are three major categories of chart patterns for stock market trading.
1. Reversal Patterns
Reversal patterns suggest that the existing trend will reverse.
Reversal patterns are:
- Head and Shoulders
- Inverted Head and Shoulders
- Double Top
- Double Bottom
- Triple Top
- Triple Bottom
- Rounding Bottom
For instance, a Double Bottom is often formed during a downtrend, and it means that bulls have taken charge.
2. Continuation Patterns
The continuation patterns imply that the existing trend will probably persist even after taking a little rest.
Some popular continuation patterns include:
- Bull Flag
- Bear Flag
- Pennant
- Rectangle
- Ascending Triangle
- Descending Triangle
These patterns are quite common while trading in the stock market since they assist in trend continuation.
3. Bilateral Patterns
These patterns signal that the market can take any path because of the possible breakout.
Examples are:
- Symmetrical Triangle
- Diamond Pattern
- Broadening Pattern
It is always important for traders to wait for the breakout before making trades.
Most Reliable Bullish Chart Patterns
Several bullish chart patterns for stock market trading consistently appear before upward price movements.
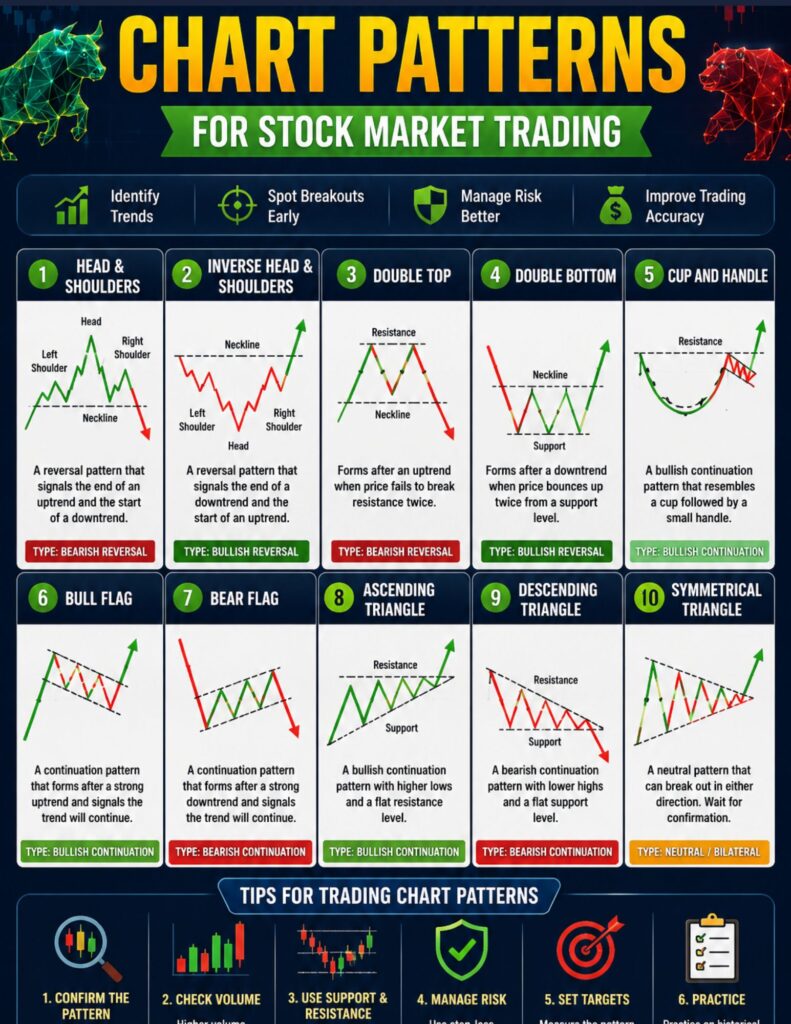
- Cup and Handle
One of the strongest bullish continuation patterns. It resembles a cup followed by a small handle before a breakout.
- Head and Shoulders Reversed
It is an indication that the sellers are weakening while the buyers are getting stronger.
- Double Bottom
An example of a reversal pattern indicating that there is solid support for the price.
- Ascending Triangle
This is formed when the buyers push the price against the resistance level until a breakout happens.
- Bull Flag
Prices form a consolidation after making a strong rally upwards.
- Most Reliable Bearish Chart Patterns
Bearish chart patterns aid stock market traders in preparation for the expected fall in the market.
- Head and Shoulders
One of the most popular reversal patterns suggesting the end of the uptrend.
- Double Top
Forms whenever the price is unable to break through the resistance level on two occasions.
- Bear Flag
combination of following an initial drop will continue moving downward.
- Descending Triangle
Characterises increasing seller dominance and usually causes a downward breakout.
- Rounding Top
Characterises the steady change in market sentiment from bullish to bearish.
How to Spot Chart Patterns Properly
New traders often misunderstand chart formations. Some tips that can help you spot patterns correctly:
- First understand the market trend.
- Understand support and resistance lines.
- Make sure there is a breakout signal.
- Look at the volume level at the time of the breakout.
- Do not trade until there is a breakout signal.
The proper spotting will make chart patterns for stock trading highly effective.
Indicators That Should Be Used Along With Chart Patterns
Chart patterns can stand alone, but when combined with technical indicators, they become more effective.
The most used indicators are as follows:
- Moving averages
- RSI
- MACD
- Volume indicator
- VWAP
- Bollinger bands
If, for instance, the formation of a bull flag coincides with RSI being above 50, together with increasing volume, it becomes a good trade setup.
Common Mistakes Traders Should Avoid
Many traders fail because they misuse chart patterns for stock market trading.
Some common mistakes include:
- Entering before breakout confirmation.
- Ignoring trading volume.
- Trading against overall the trend.
- Using oversized positions.
- Setting unrealistic profit targets.
- Ignoring stop-loss levels.
Patience is usually the difference between profitable and losing traders.
Risk Management with Chart Patterns
Even the best chart patterns for stock market trading can fail. Therefore, risk management is essential.
Always:
- Take no more than a small percentage of your capital on any one trade.
- Put your stop below the support level or above the resistance level.
- Maintain a minimum 1:2 risk-reward ratio.
- Never average down on losing trades.
- Follow your trading plan consistently.
- Risk management ensures long-term survival in the market.
Conclusion
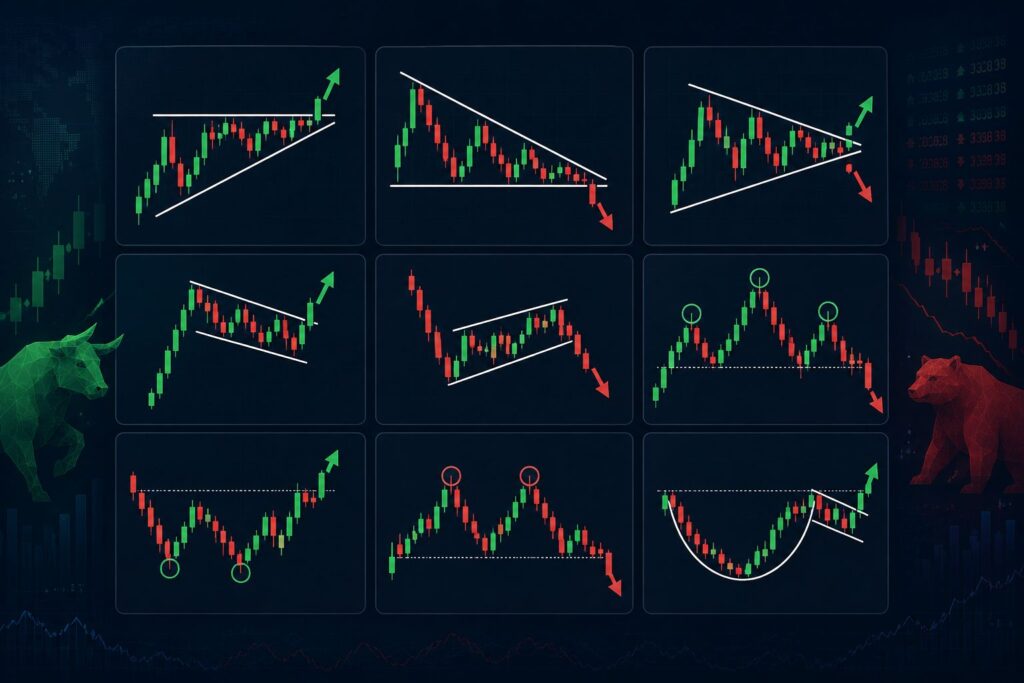
Knowing how to read chart patterns for stock market trading is among the best things that a trader can do. Chart patterns give you an idea about what the psychology of the market is, and therefore you can make decisions based on that.
Be it intraday trading, swing trading or long-term investment, learning chart patterns for stock market trading can help you in timing, making your strategy better and avoiding risks. Just keep in mind that there are no patterns that will give you guaranteed results.
FAQs – Chart Patterns for Stock Market Trading
1. What are chart patterns for stock market trading?
Chart patterns for stock market trading are price formations on a stock chart that help traders identify potential trend continuations, reversals, and breakout opportunities based on historical price movements.
2. Which are the best chart patterns for stock market trading?
Some of the most reliable chart patterns for stock market trading include Head and Shoulders, Double Top, Double Bottom, Cup and Handle, Bull Flag, Bear Flag, and Ascending Triangle.
3. Can beginners learn chart patterns for stock market trading?
Yes, beginners can learn chart patterns for stock market trading by understanding basic technical analysis, practicing on historical charts, and using demo trading accounts before investing real money.
4. How accurate are chart patterns for stock market trading?
Chart patterns for stock market trading can be highly effective when combined with volume analysis, support and resistance levels, and technical indicators. However, no chart pattern guarantees a successful trade.
5. Which timeframe is best for using chart patterns for stock market trading?
The best timeframe depends on your trading style. Intraday traders often use 5-minute and 15-minute charts, while swing traders prefer daily charts. Chart patterns for stock market trading can be applied across multiple timeframes.