
Being new to the world of stocks some of the first things that you will want to learn are how to read stock charts for beginners. Stock charts give you a graphical depiction of the price changes of stocks, allowing traders and investors to make better decisions regarding their stocks. This is not about guessing but using chart reading as a tool for making your decisions.
In this article, you will learn how to read stock charts for beginners effectively and easily, regardless of whether you have ever traded or not.
What Is a Stock Chart?
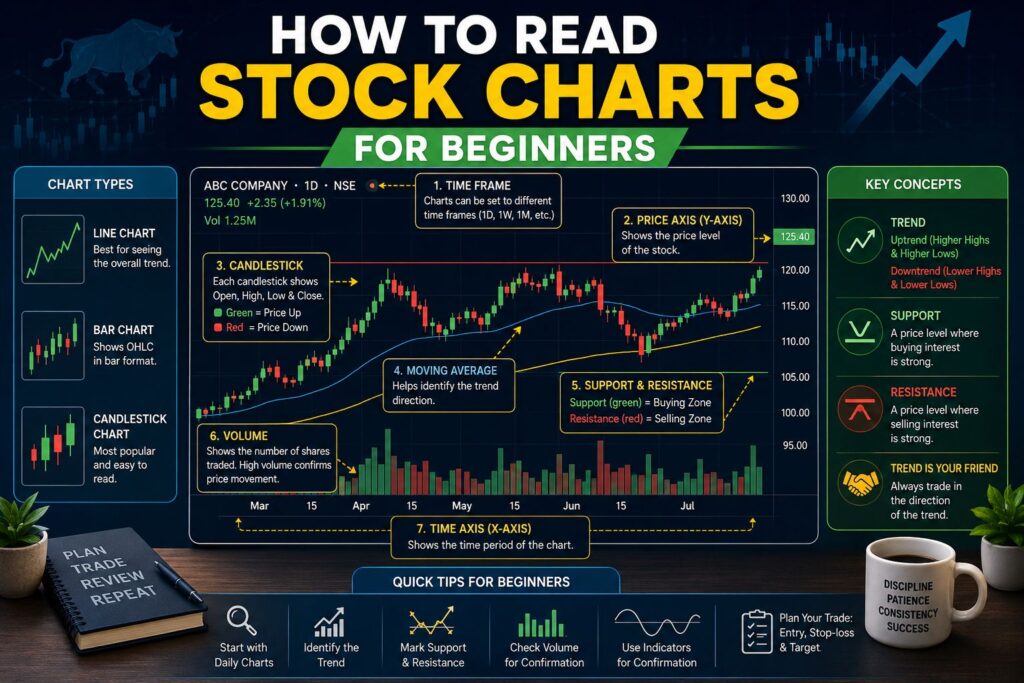
A stock chart is a chart that displays the fluctuations of a particular stock’s prices within a specific period of time. It consists of significant data such as the opening price, closing price, highest price, lowest price and volume of trades.
How to read stock charts for beginners will help you determine the trend of the stock, whether it is rising, falling, or stagnant.
Stock Charts Types
Before learning how to read stock charts for beginners, there is a need to understand the types of charts.
1. Line Chart
In this type of chart, the closing price of the stock over a period of time is linked together using lines. The chart is simple to understand and ideal for beginners who would like to know the general trend of the market.
2. Bar Chart
The bar chart shows the following four price points:
- Open
- High
- Low
- Close (OHLC)
Charts of this type give more comprehensive data than line charts.
3. Candlestick Chart
Candlestick charts are widely used by traders since they contain detailed data but remain easy to understand.
Each candlestick consists of:
- Open Price
- Close Price
- High Price
- Low Price
Green candles usually show that the buyers have control, and the red candles signal sellers control.
Time Frame Understanding
One of the most critical elements of How to Read Stock Charts for beginners is choosing the right time frame.
Different traders utilise different timeframes according to their trading approach.
- 1-Minute Chart – Scalping
- 5-Minute Chart – Intraday Trading
- 15-Minute Chart – Short-term Trading
- Hourly Chart – Swing Trading
- Daily Chart – Position Trading
- Weekly Chart – Long-term Investment
- Monthly Chart – Long-term Trend Analysis
Beginners should study daily charts because these give an idea about the movement of prices.
Price and Volume Knowledge
Each stock chart comprises two main components:
- Price
The Y-axis is the stock price.
The X-axis is time.
Monitoring changes in the stock price will tell you whether the buyer or seller is dominant.
- Volume
Volume is the amount of trading done within a particular period.
A high volume implies that there is substantial buying or selling but a low volume could mean poor participation.
Volume is one of the concepts that is discussed in how to read stock charts for beginners traders because price changes with high volumes tend to be more valid.
Identify the Trend
Markets generally move in three directions.
- Uptrend
An uptrend consists an higher highs and higher lows.
This means buyers are controlling the market.
- Downtrend
A downtrend consists an lower highs and lower lows.
This suggests that sellers have the upper hand.
- Sideways Trend
When there is a sideways trend, prices fluctuate in a fixed range but don’t show any particular direction.
Understanding these trends is crucial while studying how to read stock charts for beginners since trading according to the trend gives more opportunities.
- Support and Resistance
Support and resistance are two of the most effective ideas used in technical analysis.
- Support
Support is a price level that, when reached, sees increased demand for the asset and keeps it from falling any further.
- Resistance
Resistance is a price level that sees an increase in supply for the stock that keeps it from rising any further.
Many traders make decisions on how to trade on support and resistance levels.
Learn Basic Candlestick Patterns
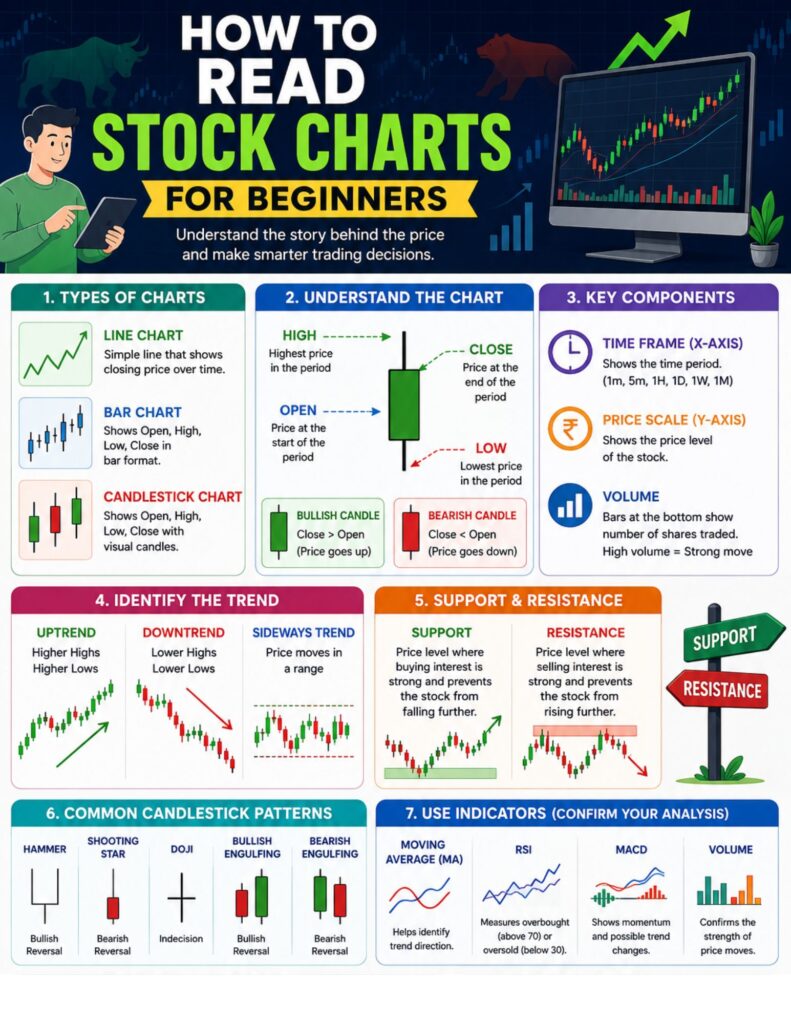
Candlestick patterns provide valuable clues about market psychology.
These include:
- Hammer
Occurs after a downtrend and usually indicates a reversal upwards.
- Shooting Star
Appears after an uptrend and may indicate weakness.
- Doji
Shows indecision between buyers and sellers.
- Bullish Engulfing
A strong bullish reversal pattern.
- Bearish Engulfing
A strong bearish reversal pattern.
Recognising these patterns will improve your understanding of how to read stock charts for beginners.
Use Moving Averages
Moving averages help smooth price fluctuations and identify the market trend.
The most commonly used moving averages are:
- Simple Moving Average (SMA)
- Exponential Moving Average (EMA)
When the stock price remains above the moving average the trend is generally considered bullish.
When the price falls below it, the trend may become bearish.
Important Technical Indicators
While charts are important, technical indicators help confirm your analysis.
- RSI (Relative Strength Index)
Measures though a stock is overbought or oversold.
- Greater than 70 = Overbought
- Less than 30 = Oversold
- MACD
Used to determine changes in trends and momentum.
- Bollinger Bands
Indicate the volatility of the market and breakout chances.
It’s recommended that beginners not use too many Chart Pattern indicators for Stock market at once. Simplicity is important when reading How to Read Stock Charts for Beginners.
Procedure for Reading Stock Charts
This is a simple procedure that every newcomer can use:
Step 1: Choose the daily time frame.
Step 2: Determine if the trend is bullish, bearish or ranging.
Step 3: Draw the support and resistance lines.
Step 4: Analysis of trading volumes.
Step 5: support your analysis using RSI or moving averages.
Step 6: Determination of entry stop loss and target before placing any trades.
Following this routine consistently is one of the easiest ways to master how to read stock charts for beginners.
Common Mistakes Beginners Should Avoid
Many new traders lose money because they make avoidable mistakes.
Common errors in trading include:
- Neglecting the market trend
- Trades without stop losses
- Use of too many indicators
- Taking tips without chart analysis
- Emotional trading
- Neglecting trading volumes
- Lack of preparation before entering the trade
Avoiding the above errors will improve your confidence in how to read stock charts for beginners.
Practice Makes Perfect
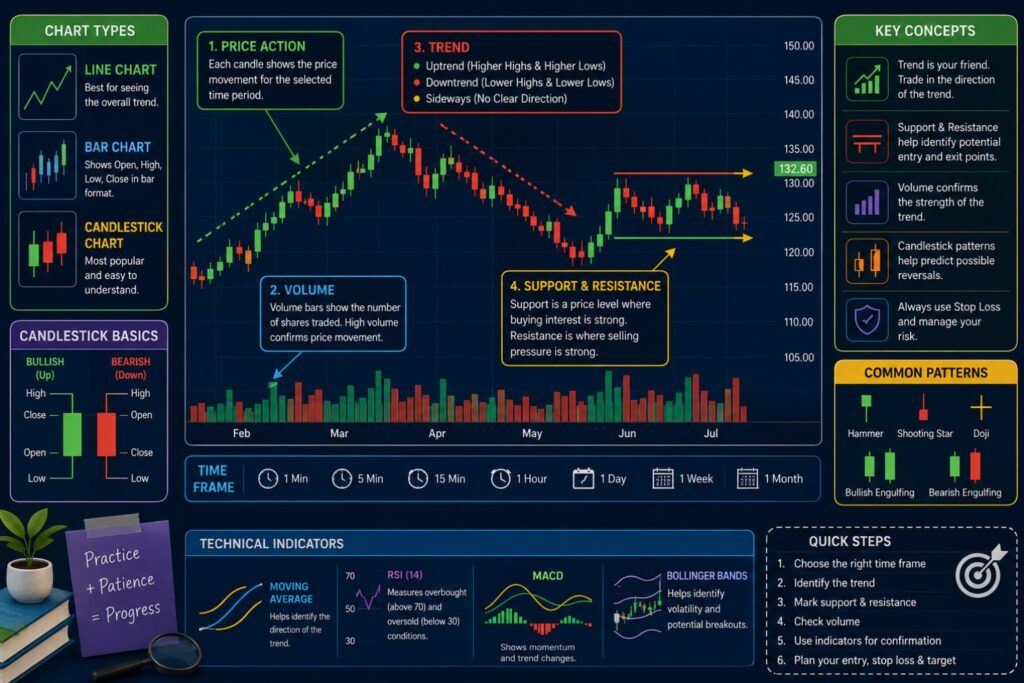
Interpreting charts is a skill that improves through practice.
Use TradingView and other charting software from your broker to read charts regularly.
Look at past charts, find trends and analyse whether the results you observed match the reality of the market.
The more you practice reading charts the better you understand the behaviour of the markets.
Conclusion
Being able how to read stock charts for beginners is one of the most important things that a person new to the stock market should know about. Using stock charts allows you to interpret the price movements and make profitable trades based on logical analysis rather than on feelings or advice.
Being able to read stock charts for beginners requires persistence and practice. You need to start with basic stuff such as trends, candlestick charts, volumes, moving averages, and then move on to more advanced technical analysis.
If you want to learn how to read charts with practice in live market conditions, with professional guidance, and real stock market trading experience, IISMT Institute provides you with the best beginner stock market courses.