In the stock market, timing is everything. Many traders enter too early, chase breakouts, or panic during minor corrections. But professional traders often wait patiently for the right moment, and that moment is usually a pullback.
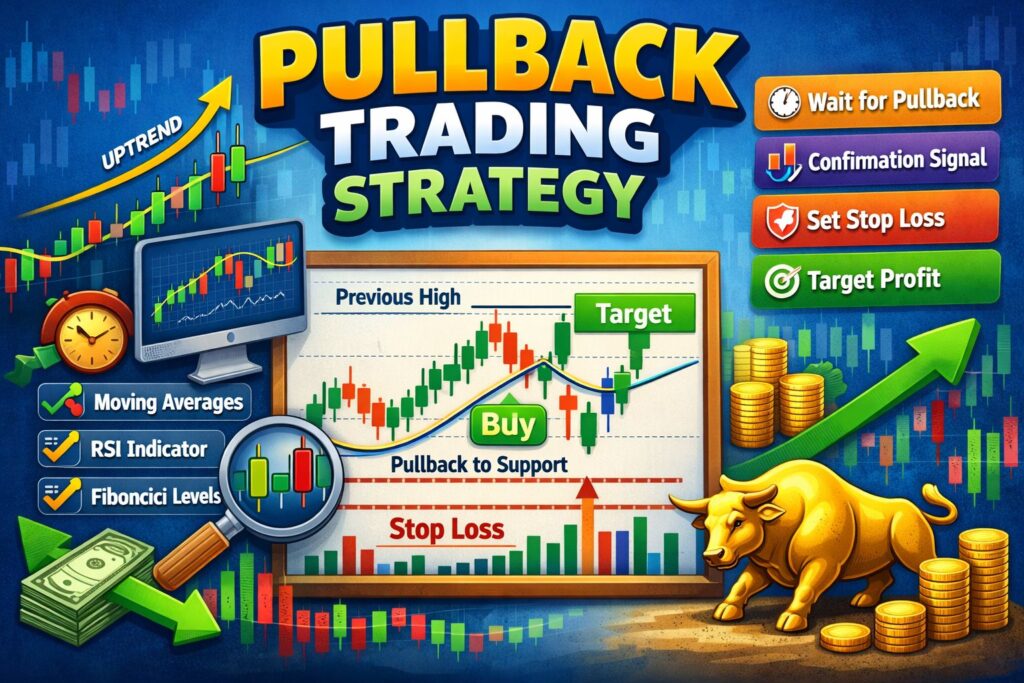
The Pullback Trading Strategy is one of the most powerful and widely used methods in trending markets. It allows traders to enter a trade at a better price while trading in the direction of the overall trend. Instead of pursuing the market, you wait for the market to come to you.
In this detailed guide, you will understand what a pullback is, how to trade it step-by-step, which indicators to use, risk management rules, and common mistakes to avoid.
What is a Pullback in Trading?
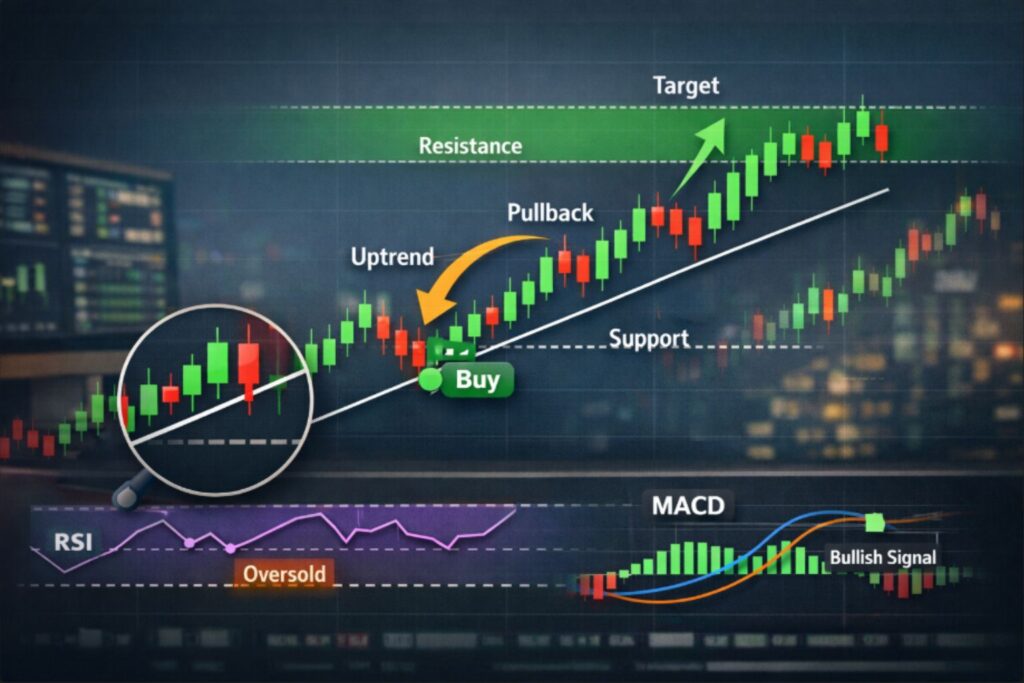
A pullback is a temporary price decline against the main trend. In a strong uptrend, prices don’t move straight up — they rise, pause, retrace slightly, and then continue upward. That temporary decline is called a pullback. Similarly, in a downtrend, prices bounce slightly upward before continuing downward.
The Pullback Trading Strategy focuses on identify these temporary retracements and entering the trade when the trend resumes.
This approach is popular because it combines trend-following with better entry pricing.
Why Traders Prefer Pullback Trading
Many beginner traders make the mistake of buying at the top of a move. Professionals, however, wait for the correction.
The Pullback Trading Strategy has the following advantages:
- Better entry price
- Smaller stop loss
- Higher reward-to-risk ratio
- Trading in the direction of the main trend
- Reduced emotional decision-making
Rather than following the trend, you buy at a reduced price in an uptrend or at a premium price in a downtrend.
Understanding the Trend Before Using the Pullback Strategy
Before applying the Pullback Trading Strategy, you must clearly identify the market trend.
- Uptrend
- Higher Highs
- Higher Lows
- Downtrend
- Lower Highs
- Lower Lows
If the market is moving sideways, the Pullback Trading Strategy may not work effectively. This strategy performs best in trending conditions.
You can identify trends using:
- Moving averages (20 EMA, 50 EMA, 200 EMA)
- Trendlines
- Market structure analysis
- Price action
Types of Pullback Trading Strategy
There are different ways traders apply the Pullback Trading Strategy depending on their style.
1. Moving Average Pullback
Price retraces to a key moving average (like 20 EMA or 50 EMA) and then resumes the trend.
2. Fibonacci Retracement Pullback
Traders use Fibonacci levels (38.2%, 50%, 61.8%) to identify potential pullback levels.
3. Support & Resistance Pullback
Price falls below resistance testing it as support before continuing the uptrend.
4. Trendline Pullback
Price reverses at a trendline bouncing back.
All forms of the Pullback Trading Strategy are based on the same idea: trading with the trend, after a brief pullback.
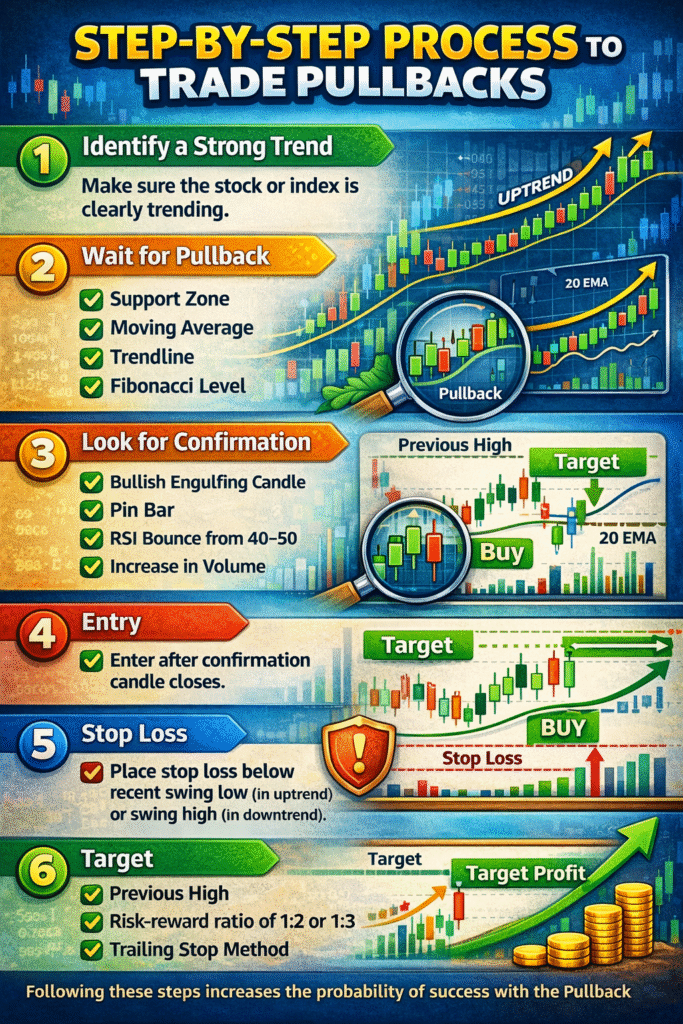
Step-by-Step Process to Trade Pullbacks
Now, let’s understand the Pullback Trading Strategy in a step-by-step process:
Step 1: Identify a Strong Trend
Ensure that the stock or index is trending.
Step 2: Wait for Pullback
Don’t enter the trade immediately. Wait for the price to move back to a significant level:
- Support zone
- Moving average
- Trendline
- Fibonacci level
Step 3: Look for Confirmation
Confirmation can be:
- Bullish engulfing candle
- Pin bar
- RSI bounce from 40–50 in an uptrend
- Increase in volume
Step 4: Entry
- Enter after the confirmation candle closes.
Step 5: Stop Loss
- Place stop loss below the recent swing low (in uptrend) or swing high (in downtrend).
Step 6: Target
Target may be:
- Previous high
- Risk-reward ratio of 1:2 or 1:3
- Trailing stop method
By following these steps there are chances of success in the Pullback Trading Strategy.
Indicators That Improve Pullback Accuracy
Although price action is strong, indicators can improve the Pullback Trading Strategy:
Moving Averages
- 20 EMA for short-term trend
- 50 EMA for medium-term trend
RSI (Relative Strength Index)
- RSI above 50 in an uptrend indicates strength.
Volume
- Volume spike in trend continuation indicates strength.
MACD
- Helps confirm momentum alignment.
Using Confluence improves trade quality in the Pullback Trading Strategy.
Risk Management Rules
No strategy works 100% of the time. Proper risk management is essential while using the Pullback Trading Strategy.
- Risk only 1–2% of capital per trade
- Maintain a minimum 1:2 risk-reward ratio.
- Avoid overtrading
- Never remove a stop loss.
- Avoid trading in choppy markets.
Even the best Pullback Trading Strategy setup can fail without discipline.
Common Mistakes Traders Make
- Mistaking pullback for reversal
- Entering too early
- Entering trades in a sideways market
- Not paying attention to the trend on the higher timeframe
- Making decisions based on emotions
A genuine Pullback Trading Strategy trade honors structure and confirmation.
Pullback vs Reversal – Know the Difference
Many traders lose money because they assume every retracement is a pullback.
A pullback:
- Temporary correction
- Occurs within a strong trend
- Followed by continuation
A reversal:
- Breaks structure
- Changes trend direction
- Forms lower highs in an uptrend or higher lows in a downtrend
Understanding this difference is critical for mastering the Pullback Trading Strategy.
Best Timeframes for Pullback Trading
The Pullback Trading Strategy can be applied to various timeframes:
- Intraday Traders
- 5-minute & 15-minute charts
- Swing Traders
- 1-hour & daily charts
- Positional Traders
- Daily & weekly charts
Analysis of multiple timeframes increases the accuracy of the trade. For instance:
recognize the trend on the daily chart and enter it on the 1-hour chart.
Real Example
Suppose Nifty is in a strong uptrend with higher highs and higher lows.
Price moves from 20,000 to 20,500.
Then retraces back to 20,350 near the 20 EMA.
A bullish engulfing candle forms.
This becomes a classic Pullback Trading Strategy entry.
Stop loss below 20,300.
Target near 20,600.
Risk = 50 points
Reward = 250 points
Risk-reward = 1:5
This is how professionals trade patiently.
Advantages of Pullback Trading Strategy
- High probability in trending markets
- Lower risk entry
- Clear structure-based stop loss
- Logical trade planning
- Works in stocks, indices, forex, and commodities
Because of its structured approach, the Pullback Trading Strategy is preferred by institutional traders.
Limitations of Pullback Trading Strategy
- Not effective in sideways markets
- Requires patience
- False pullbacks can trap traders.
- Needs verification
There is no foolproof strategy, but with disciplined implementation, the Pullback Trading Strategy is extremely effective.
Final Thoughts
Trading is not about predict what will happen next. It is about following a systematic approach with discipline. The Pullback Trading Strategy educates traders to wait, observe, and enter at logical points rather than following the market.
With expertise in trend identification, confirmation signals, and risk management, this strategy will help you trade more consistently.
Remember:
The market rewards patience, not impulse.
Before trading with real money, practice on charts, backtest previous data, and develop confidence.
When you applied correctly, the Pullback Trading Strategy can become a powerful weapon in your trading journey.